(Reporting Org Stats JSON)
Reporting Org: Netherlands Enterprise Agency (RVO)
Headlines
| View this Reporting Org elsewhere |
On D-Portal
On IATI Validator On the Dashboard API |
| Reporting Org's website | https://projects.rvo.nl/ |
| Short Name |
rvo
|
| Human Readable Name | Netherlands Enterprise Agency (RVO) |
| Reporting Org Ref |
NL-KVK-27378529
|
| Reporting Org ref(s) in Data |
NL-KVK-27378529
|
| Organisation Type | Government (10) |
| HQ Country | Netherlands (the) (NL) |
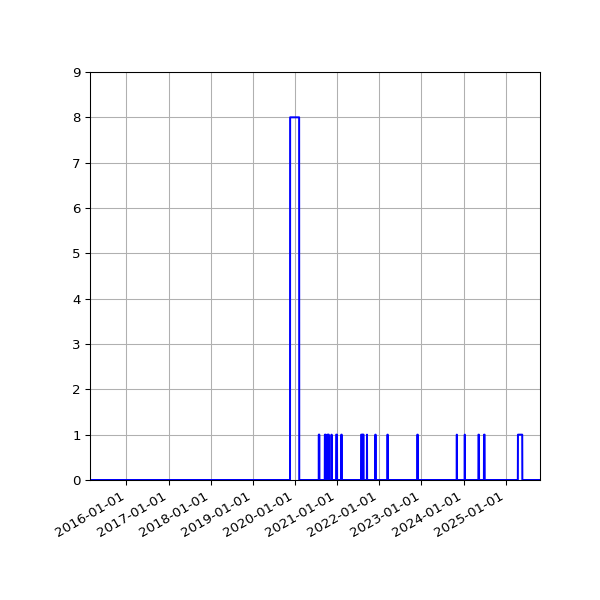
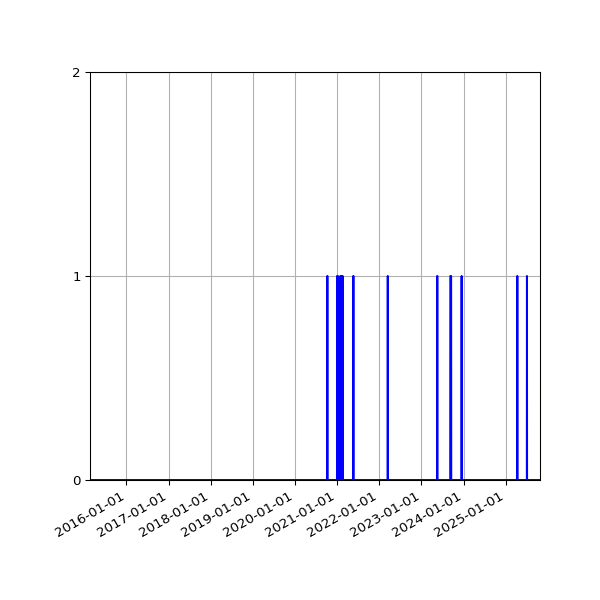
| Total Datasets | 2 |
| Datasets with Activity data | 2 |
| Datasets with Organisation data | 0 |
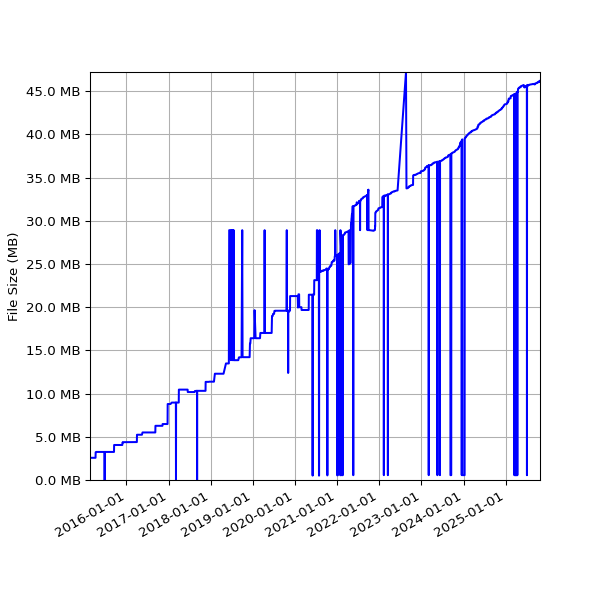
| Total File Size | 50.2 MB |
| Activities | 5921 |
| Unique Activities | 5921 |
| Organisations | 0 |
| Versions |
2.03
|
| Hierarchies |
1
2
|
| Licenses |
odc-pddl
|
| Files failing schema validation | 0 |
Activities
(J)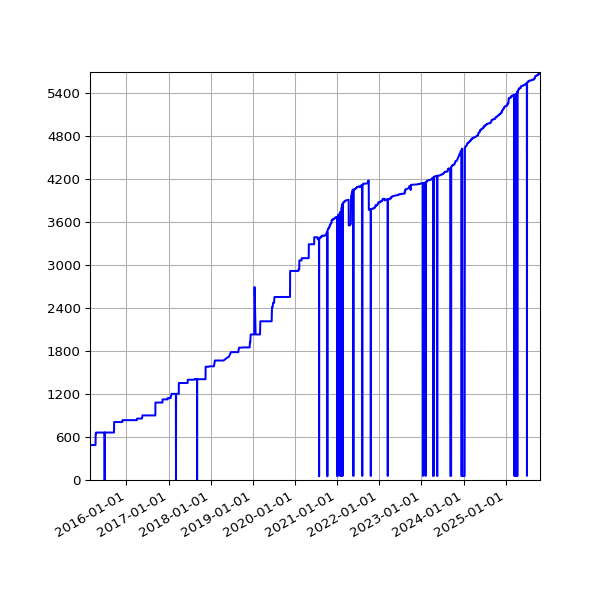

Errors
No issues were found.
Financial
Budgets
The below figures are calculated based on the data contained within the <budget> element for each reported activity. Original and revised elements are based on the value declared in the budget/@type attribute. Where budgets fall across two calendar years, the month of the <period-end> date is used to determine annual groupings, with budgets for periods ending January-June added to the previous calendar year.
| Year | Count (all) | Sum (all) | Count (Original) | Sum (Original) | Count (Revised) | Sum (Revised) |
|---|---|---|---|---|---|---|
| Total | 8402 |
1907915467.44 EUR |
8402 |
1907915467.44 EUR |
||
| 2004 | 1 |
200000.0 EUR |
1 |
200000.0 EUR |
||
| 2005 | 1 |
900000.0 EUR |
1 |
900000.0 EUR |
||
| 2009 | 1 |
70000000.0 EUR |
1 |
70000000.0 EUR |
||
| 2010 | 9 |
71610004.0 EUR |
9 |
71610004.0 EUR |
||
| 2011 | 30 |
79694798.03 EUR |
30 |
79694798.03 EUR |
||
| 2012 | 90 |
96591504.39 EUR |
90 |
96591504.39 EUR |
||
| 2013 | 147 |
203506915.28 EUR |
147 |
203506915.28 EUR |
||
| 2014 | 301 |
154137298.4 EUR |
301 |
154137298.4 EUR |
||
| 2015 | 760 |
182990985.46 EUR |
760 |
182990985.46 EUR |
||
| 2016 | 708 |
8214064.94 EUR |
708 |
8214064.94 EUR |
||
| 2017 | 649 |
26151723.7 EUR |
649 |
26151723.7 EUR |
||
| 2018 | 734 |
48093444.62 EUR |
734 |
48093444.62 EUR |
||
| 2019 | 705 |
66923831.22 EUR |
705 |
66923831.22 EUR |
||
| 2020 | 598 |
85204604.33 EUR |
598 |
85204604.33 EUR |
||
| 2021 | 668 |
120458252.68 EUR |
668 |
120458252.68 EUR |
||
| 2022 | 531 |
164786406.79 EUR |
531 |
164786406.79 EUR |
||
| 2023 | 758 |
89901695.96 EUR |
758 |
89901695.96 EUR |
||
| 2024 | 857 |
198194758.19 EUR |
857 |
198194758.19 EUR |
||
| 2025 | 755 |
142685368.57 EUR |
755 |
142685368.57 EUR |
||
| 2026 | 99 |
97669810.88 EUR |
99 |
97669810.88 EUR |
Exploring Data
Files
| Short Name | Links | Activities (J) | Organisations (J) | File Size (J) | Version (J) |
|---|---|---|---|---|---|
| rvo-01 | Source Url IATI Validator | 5862 | 0 | 49.6 MB | 2.03 |
| rvo-activities | Source Url IATI Validator | 59 | 0 | 586.2 kB | 2.03 |
(J)
Codelist Values (version 2.xx)
(J)
Elements and Attributes Published
Organisation Identifiers
| Org Type | Total | Self Refs | Excluding Self Refs | |||||||
|---|---|---|---|---|---|---|---|---|---|---|
| Org Elements | Refs | Non-Empty Refs | Org Elements | Refs | Non-Empty Refs | Valid Refs | Percentage of Org Elements with Valid Refs | |||
| Accountable | 5,916 | 5,915 | 5,915 | 5,914 | 2 | 1 | 1 | 1 | 50 | (J) |
| Extending | 0 | 0 | 0 | 0 | 0 | 0 | 0 | 0 | 0 | (J) |
| Funding | 5,935 | 5,934 | 5,920 | 5,855 | 80 | 79 | 65 | 65 | 81 | (J) |
| Implementing | 8,751 | 8,722 | 5,229 | 209 | 8,542 | 8,513 | 5,020 | 5,016 | 59 | (J) |
| Provider | 2,400 | 2,400 | 2,400 | 122 | 2,278 | 2,278 | 2,278 | 2,275 | 100 | (J) |
| Receiver | 30,444 | 66 | 66 | 65 | 30,379 | 1 | 1 | 0 | 0 | (J) |